Advanced results configuration
Customize the display of results in your Live Voting project
- Show only relevant information and values
- Provide added value for voters
- Customize the display for each voting result
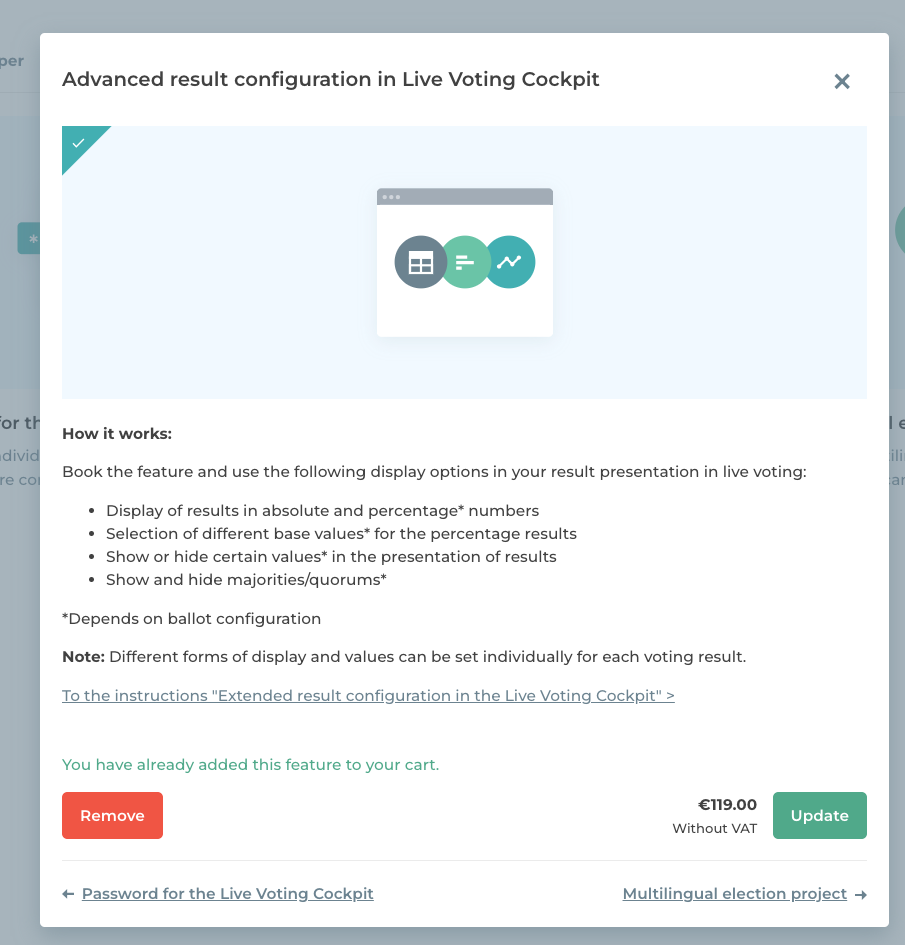
The feature “Advanced Results Configuration in the Live Voting Cockpit” allows you to individually display and adapt the appearance of the results for your voting items. The Live Voting Cockpit can be used by the election administrator to display only the information and values that are relevant for this result. The feature also offers a variety of additional values, filters and display options that are not available by default in the Live Voting Cockpit.
Note: This feature is purely a Live Voting feature and can therefore only be booked for the POLYAS Live Voting product.
1) How to book the Advanced Results Configuration
To book the feature, go to your Live Voting project in the POLYAS Online Voting Manager and, on the Feature tab, click the corresponding feature tile. Book the feature for your Live Voting project by clicking the green “Add” button. No further steps are required to set up the feature. Complete the setup, seal and launch your Live Voting project.
2) Configuring the results in the Live Voting Cockpit
After each vote, you can display the results to your voters in the Live Voting Cockpit. After you have ended the voting and the results have been counted, you will find a slider symbol on the right in the “Results” tab. Clicking on the symbol opens a modal dialog, which you can use to customize the display of the result.
More about the results display in the Live Voting Cockpit >
2.1 Configuration options
Depending on how you configured your ballot paper, the following can be set:
- Display of results in absolute and percentage numbers
- Selection of different base counts for the percentage results (e.g. all valid ballots, possibly with invalid votes, blank votes, abstentions)
- Show or hide certain values when presenting the results (e.g. turnout, invalid votes, blank votes or abstentions)
- Show and hide majorities/quorums
Please note that depending on the ballot type and configuration, some options for the result configuration are not available and are therefore not displayed. The appearance of the modal dialog “Results display” varies accordingly.
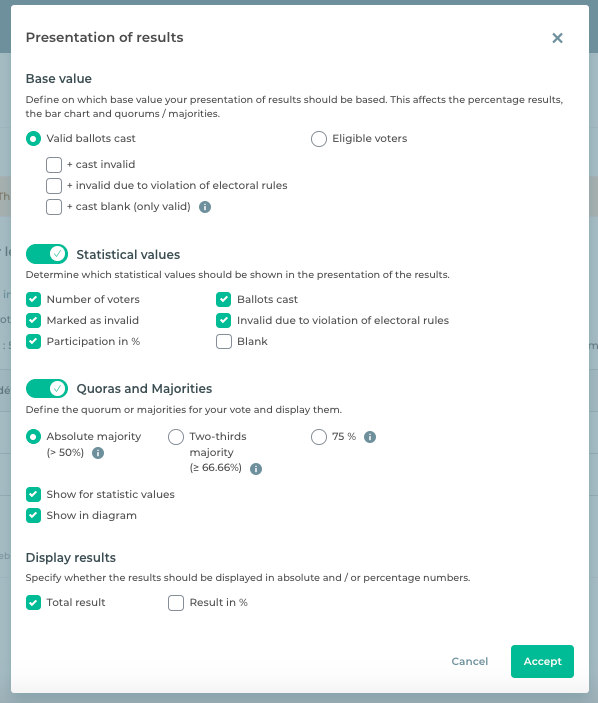
2.2 Base count
The base count defines the basis for your results display. Also, the base count selected affects the percentage results, the bar chart, and majorities.
For the base count, you can choose between “Eligible voters” and “Valid ballots cast”. With the latter, you can also adjust the base count by adding further options, such as the ballots cast.
Eligible voters
If you select “Eligible voters” as the base count, the results are calculated on the basis of all potential voters on this ballot. This number can differ from the total number of voters due to the definition of voter groups.
Valid ballots cast
If you select “Valid ballots cast” as the base count, the results are calculated using all valid, non-blank ballots cast.
+ marked invalid
In addition to the valid, non-blank ballot papers, all of the ballot papers marked as “invalid” by selecting the checkbox are counted towards the base count.
+ invalid due to voting rule violation
If you select this, then the base count includes not only the “Valid ballots cast” but also those ballot papers for which too few or too many votes were cast per ballot paper, list, or voting option, thus violating the voting rules.
+ abstentions
In addition to the “Valid ballots cast”, all abstentions cast by means of the checkbox are counted.
+ cast blank
Ballot papers on which no votes have been cast are considered blank. If the minimum number of votes was set to 0, the blank ballots are not counted as invalid but added here. If a value > 0 (e.g. 1) was set as the minimum number of votes, a blank ballot violates the voting rules, which is why it is only counted as “invalid due to voting rule violation”.
Note: The default selection here is “Valid ballots cast”/ “+ marked invalid” / “+ invalid due to voting rule violation” / “+ abstentions”/ “+ cast blank”.
2.3 Statistical values
All statistical values you have selected are shown in the results display above the results table or the results diagram. This offers your voters more information about the results. You can show or hide the following values:
- Number of eligible voters
- Ballots cast
- Turnout in %
- Invalid due to voting rule violation
- Marked as invalid
- Marked as abstain
- Cast blank
If you do not want to display statistical values, you can deactivate them using the main controller.
Note: By default, all values are shown here except for “Cast blank”. If you have not activated the options for marked as invalid or abstention in the ballot-paper settings, these two values will not be displayed as options. For your security, “invalid due to voting rule violation” and “cast blank” are also displayed even if an invalid (or blank) vote is technically prevented by our system.
2.4 Quorums & majorities
Under “Quoras and majorities” you can display the majority or quorum required for this vote according to your election regulations. You can choose between:
- Absolute majority (>50%),
- Two-thirds majority (≥ 66.66%)
- or 75% majority (≥ 75%).
You can specify where this is displayed, i.e. with the statistics, as a vertical line in the diagram, or both. If you do not want to display quorums or majorities, you can deactivate them using the main controller.
Note: Depending on the ballot type and configuration, the calculation and display of quorums and majorities may not be possible (see Chapter 4).
Learn more about quorums in our election glossary >
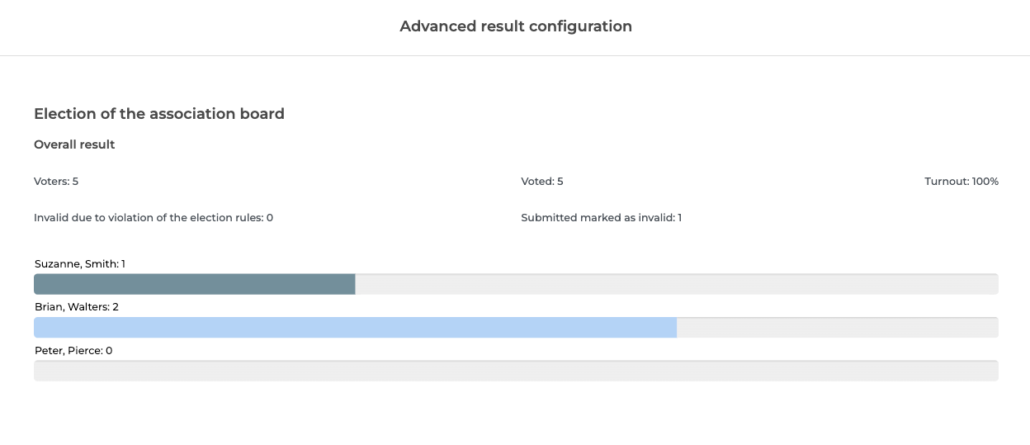
2.5 Results display
Under the item “Results display”, the modal dialog lets you decide whether the result is displayed
- in absolute numbers,
- or in percentages (%).
Note: The default selection is “Results absolute”. Depending on the ballot type and configuration, it may not be possible to use both display options (see Chapter 4).
3) Other ways to display and filter the results
Depending on which features you’ve added to your Live Voting project, you’ll have other options for displaying your results or filtering them according to certain criteria:
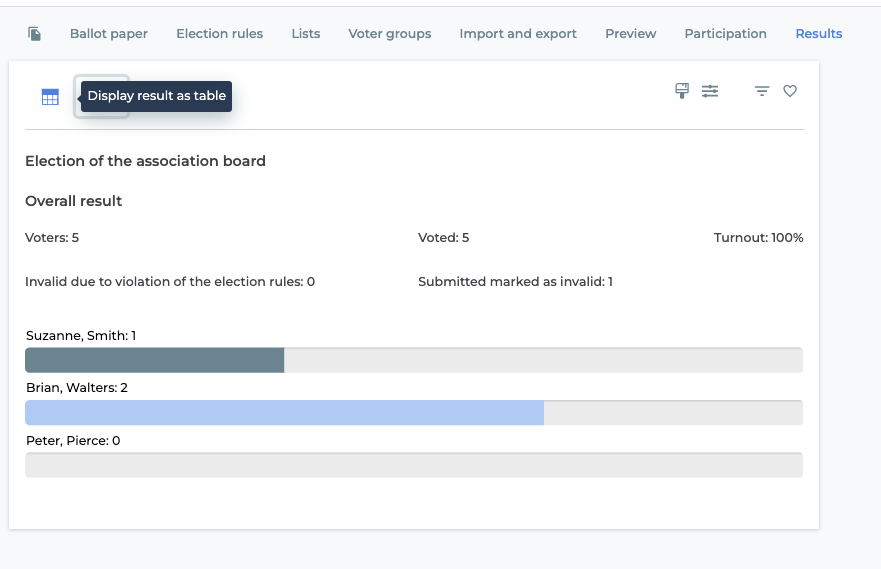
3.1 Table or bar chart display
The basic version of the POLYAS Live Voting tool lets you choose between displaying the results to your voters as a table or bar chart. You set this in the Live Voting Cockpit after the votes have been counted by clicking on the respective ballot paper and then on “Results”. You’ll find a table symbol and a bar symbol above the results on the left. Select your choice with a click and see below how the preview of your results changes.
Note: In the case of weighted results and depending on the ballot type and configuration, only the table view is available (see Chapter 4).
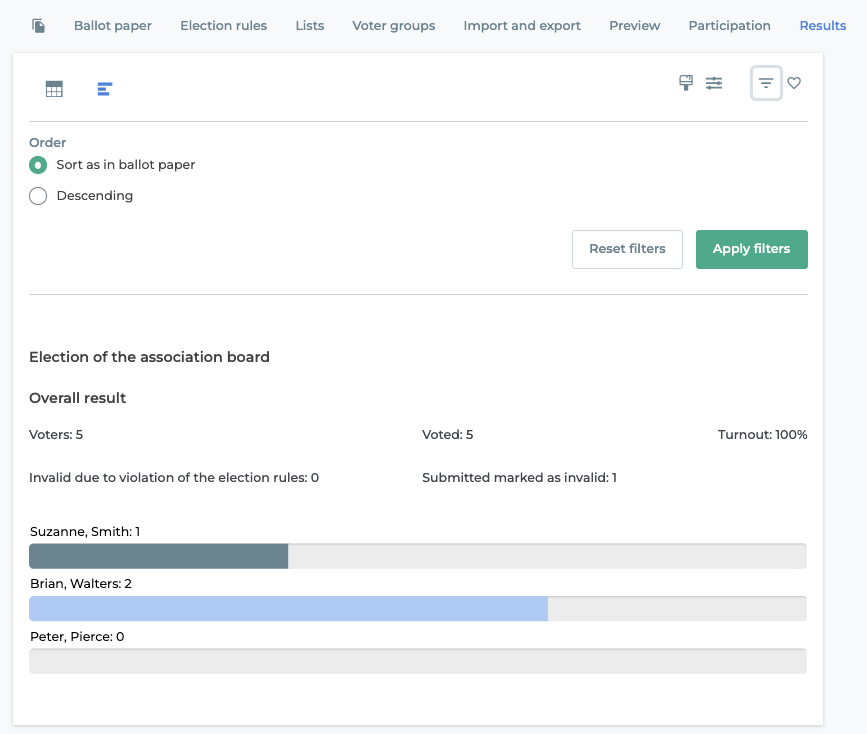
3.2 Specify sorting
At the top right of the slider icon there’s a filter icon. Use this to specify the order in which you want the results to be displayed:
- Sort by ballot
- In descending order
If you use “Sort by ballot”, the results are displayed in the order as balloted. If you sort in descending order, the result with the most votes is displayed at the top. This is also available with the basic version of POLYAS Live Voting product.
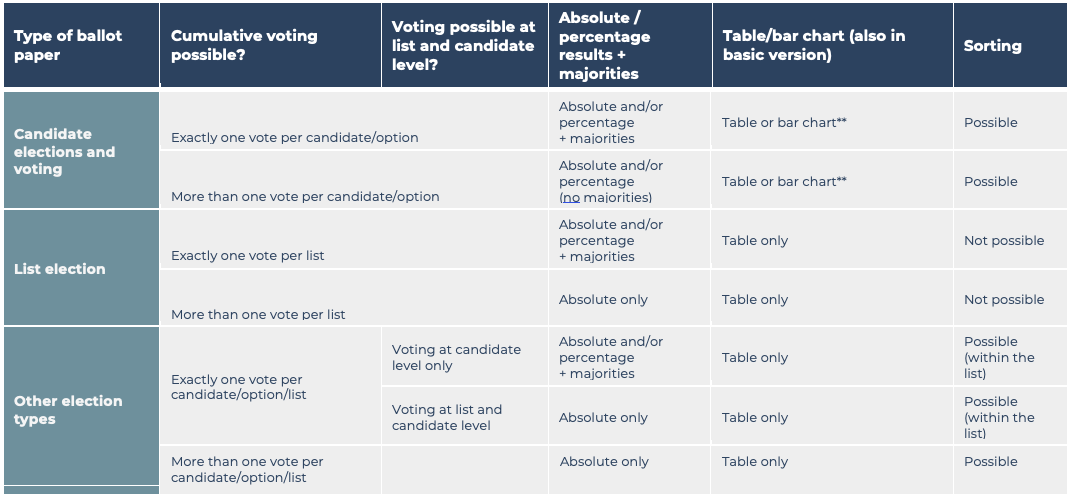
3.3 How the display options depend on the ballot type
The following table shows the dependencies of the configuration options in relation to the ballot paper settings and the ballot paper type:
4) Combining this feature with other features
4.1 In combination with the “Ballot Weighting” feature
If you’ve chosen the Ballot weighting feature, you’ll find the “Ballot Weighting” item in the sorting filter area. This is where you can specify whether only weighted results are to be displayed or only unweighted results, or both unweighted and weighted results.
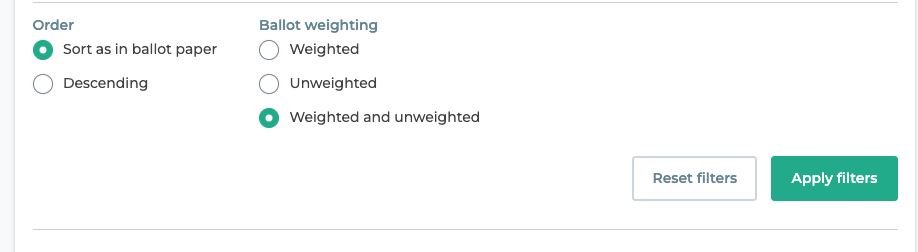
Note: the results can only be displayed as a bar chart if you’ve specifically selected the unweighted results.
More on the Ballot Weighting feature >
4.2 In combination with the “Analysis Groups” feature
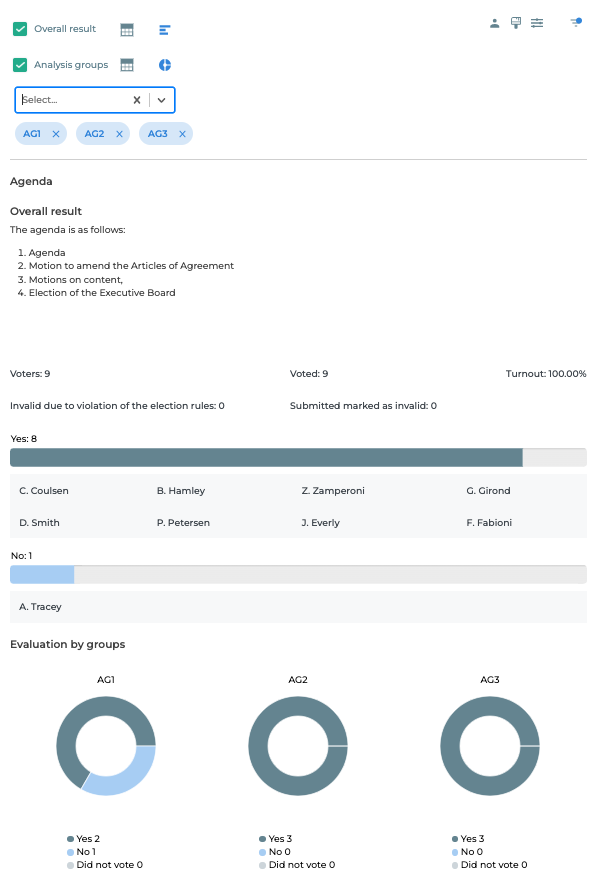
If you use the “Analysis Groups” feature, you’ll find an item called “Analysis Groups” in the “Results” area under “Overall result”; you can select this by clicking on the box. Depending on what you tick, just the following will be displayed:
- the overall result
- or the overall result and the results for the group you selected
Note: the overall result is selected here by default.
To select the analysis group you want to view in addition to the overall result, click on the drop-down menu that appears below the “Analysis groups” and select the corresponding group.
More on the Analysis Groups feature >
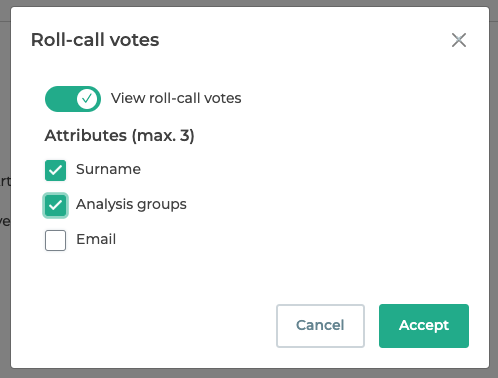
4.3 In combination with the “Open vote” feature (also known as “Roll-call votes”)
Combining the “Advanced result configuration” feature with the Open vote feature (also known as “Roll-call votes”) will give you additional configuration options for displaying the results of the open votes or votes by name.
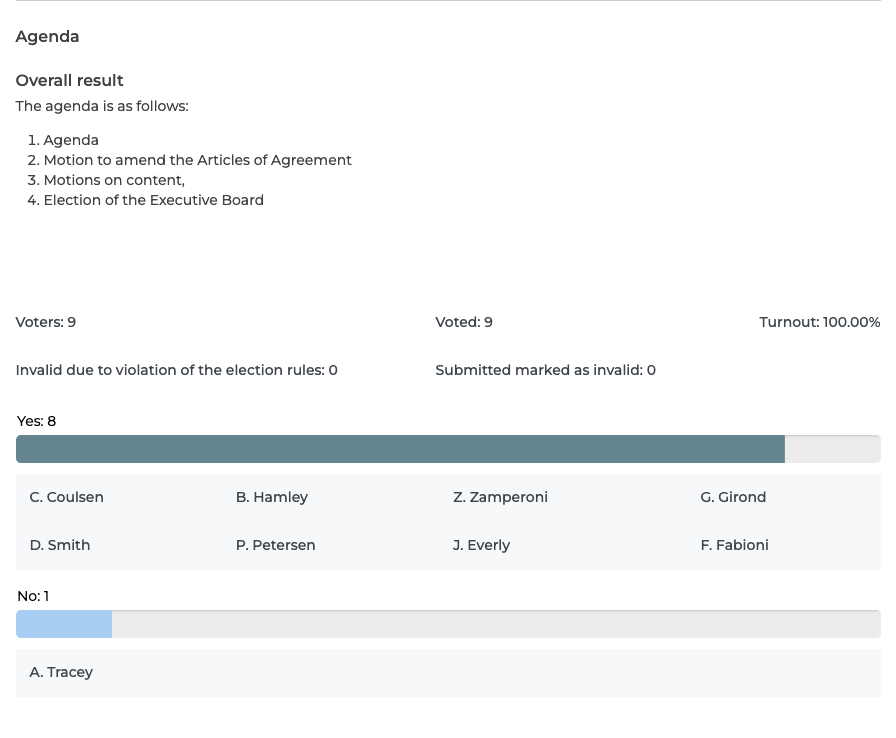
Click on the person icon in the top right-hand corner to show the votes by name and to display a maximum of three of the attributes of the voters you entered in the register of voters; these are then displayed in the result.
In addition to the table view, you can also choose a bar chart view. To change the view, click on the corresponding icon next to “Overall result”. Next, click on “Display results” at the bottom right to display the results to your voters with the view you selected.
Please note: A bar chart view of the open votes cannot be used for weighted results.
POLYAS tip: if you additionally filter your results according to analysis groups, the results can also be displayed as a donut chart.