
Creating analysis groups
Filter your voting results using analysis groups
- Simplified analysis of the voting results
- Easy configuration in the Online Voting Manager
- Differentiated presentation of results for your eligible voters
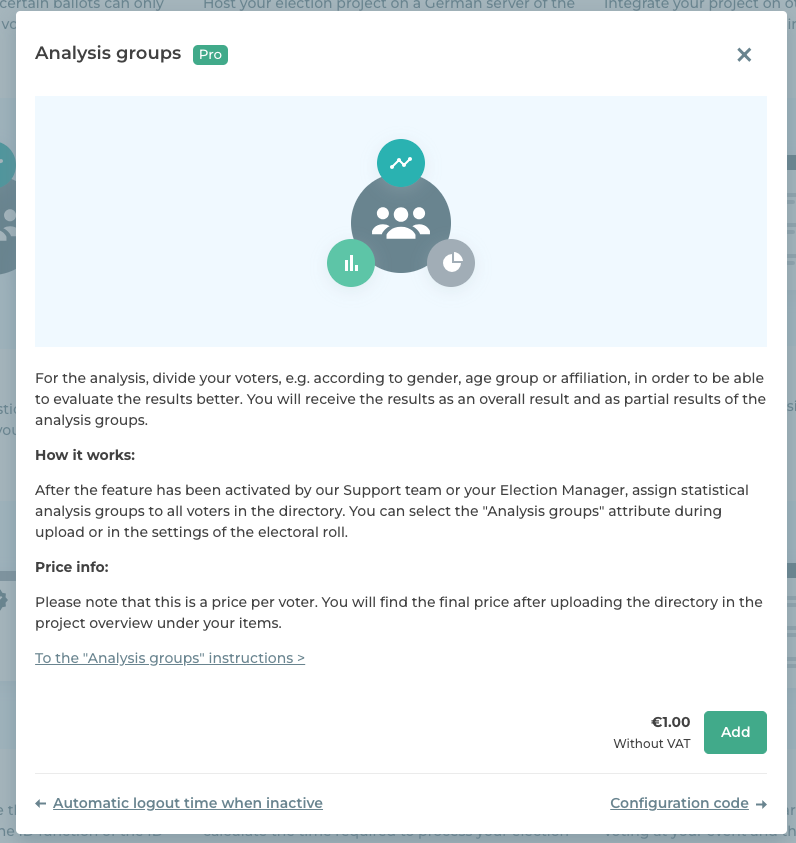
1. Booking the feature “Analysis groups”
The “Analysis groups” feature allows you to filter the results of your Live Voting according to predefined groups and to display them as groups. This makes it easier to evaluate the results of your voting. You can, for example, categorize your voters according to gender, age group, membership, or affiliation. After the voting, you receive the overall result and the partial results as differentiated by your analysis groups.
To book the feature, please contact the POLYAS Support team or your Election Manager stating your project identifier (support@polyas.com).
Note: This feature is available for Online Voting and for Live Voting.
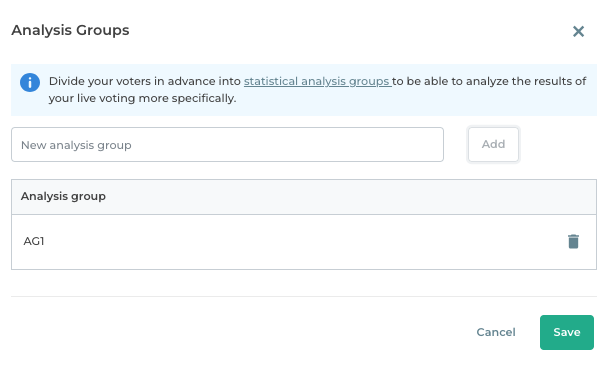
2. Adding analysis groups
In the POLYAS Online Voting Manager, switch to the tab “Eligible voters” and go to “Analysis groups”: You can add your analysis groups here. Click in the “New analysis group” field and enter the desired name for the group. Then click “Add”. The analysis groups you have added then appear in the table below. To delete an analysis group, click on the trash-can icon to the right of the group.
Note: Each eligible voter can be assigned to any number of analysis groups. To do this, fill out the “Analysis groups” column with the names of the analysis groups separated by commas.
A maximum of 20 analysis groups can be used in total, as the results cannot be subdivided into more than 20 partial results.
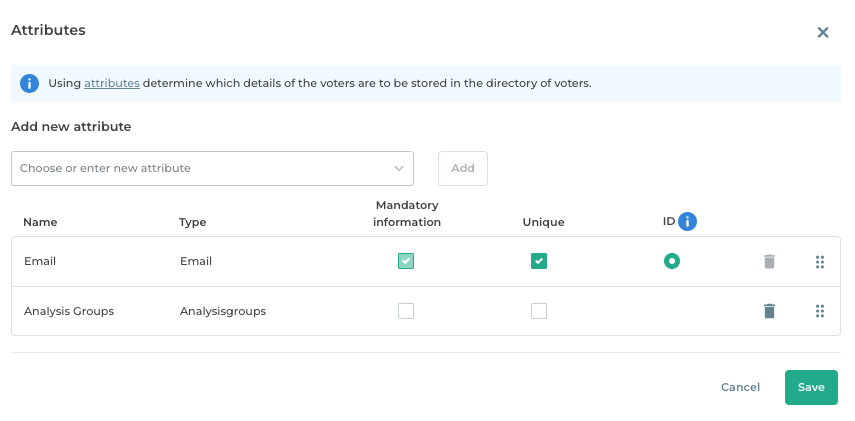
3. Adding the register of voters
Now switch to “Attributes” and, under “Add new attribute”, select the “Analysis groups” attribute and click on “Add”. Your register of voters now has a new column titled “Analysis groups”. In the same way you add appropriate attributes for all of the information that your register should contain (e.g. surname, first name …).
With this done, you can fill in your register of voters manually or upload it as an Excel file.
Excel upload
Our Excel template helps you to create your register of voters in Excel. You will find it in the POLYAS Online Voting Manager under the settings for your register of voters under “Import” in the blue information box. In the Excel table, be sure to have a column for each attribute used, if possible with the name of the attribute in the header, and fill out the fields. Create an extra column for the analysis groups and fill this with the identifier of the analysis group(s) that the respective voter should belong to. Then upload the register using the “Import” tab.
Then assign the columns to the appropriate attribute and click “Save”.
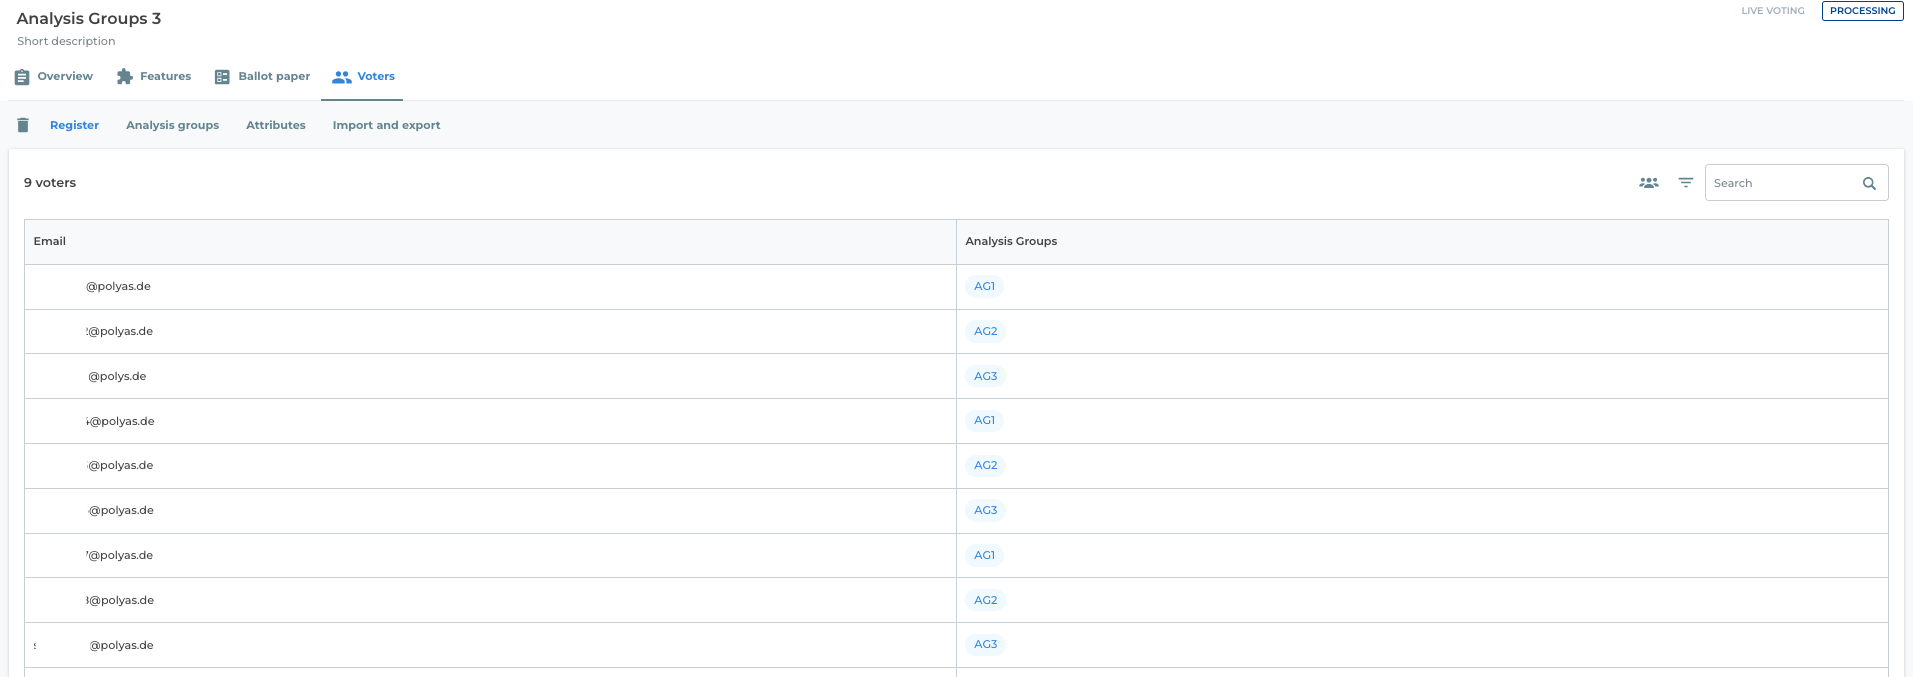
4. Record live voting results with evaluation groups
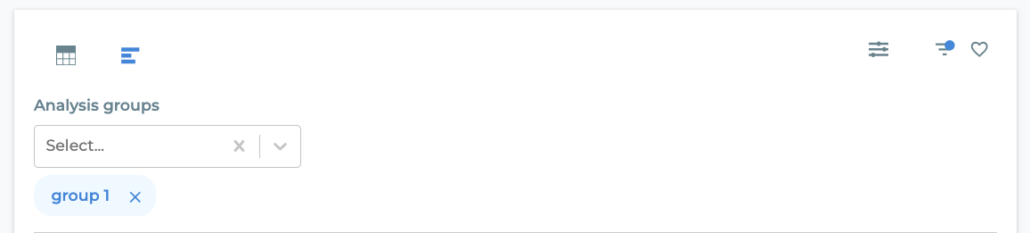
If you use the feature as part of a live vote, you can view the results after each voting round and display them to your voters. To do this, click on a completed vote. Under “Results” you can now view the participation and the distribution of votes. You will find a slider symbol on the right. Click on this to display the results in a different form. You can define and display majorities or quorums here. Next to the slider symbol you will also find a filter symbol: You can use this to define the sorting of the results.
On the left, you will find icons that allow you to choose between a table or bar chart view. Below this, you can also display the results for your evaluation groups. To do this, use the drop-down menu to select the groups for which you want to see the results. If you have added a group, it will appear in blue below the drop-down menu. If you have selected a group by mistake, you can remove it again using the X symbol.
Filter and customization options for the results
POLYAS tip: If you have booked our “Advanced results configuration”, you can also display the results of the evaluation groups as a donut chart.
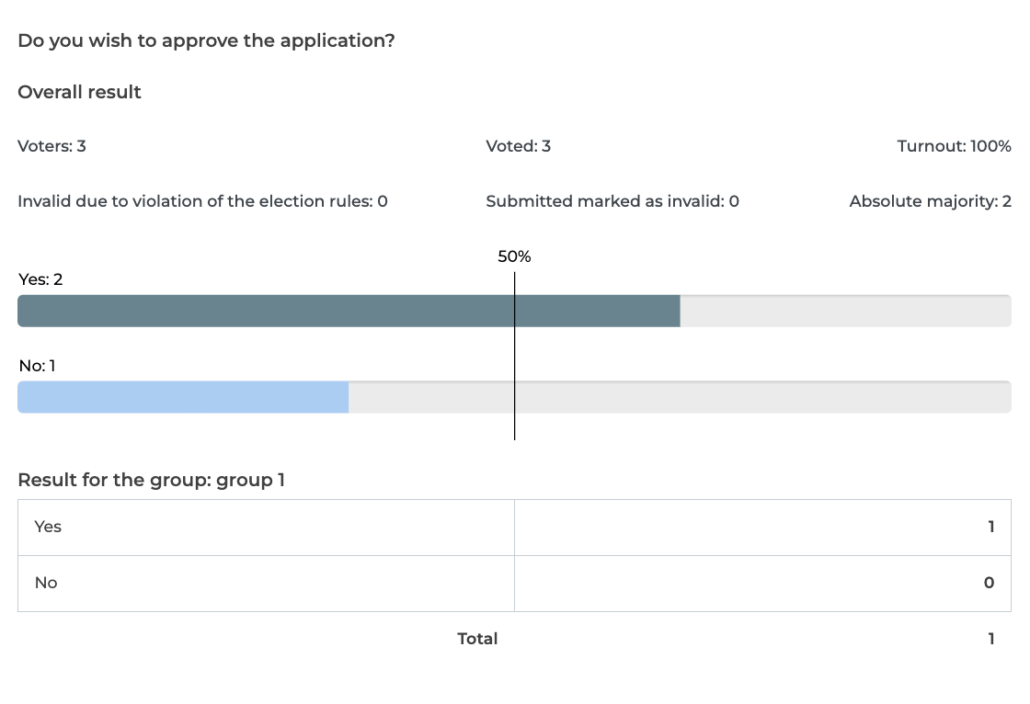
The results then appear sorted by:
- Overall result
- Group 1
- Group 2
- Etc.
Note: To change the order of the groups in the results display, select the group that you want to display at the top. Proceed in the same way with the next evaluation group in the order of the desired display.
By clicking on “Show results”, you can display the selected results view to your voters. You can read more about this here >
Display results with evaluation groups in Live Voting.
If you use evaluation groups for your online election, you can download your election result in the POLYAS Online Voting Manager after the election has ended. You will then receive the overall result and the result broken down by evaluation group.